

Why Customer Lifetime Value Matters for Small Businesses
Customer lifetime value (CLV) is the total value a single customer brings to your business over the entire relationship, not just the first sale. It counts repeat purchases, renewals, upsells, and cross-sells, and it becomes more useful when you subtract the cost of serving that customer.
This guide gives owners and marketers of local service, e-commerce, and SaaS businesses a practical way to calculate customer lifetime value, compare it with customer acquisition cost, and use both numbers in marketing decisions.
What Is Customer Lifetime Value (CLV)?
Customer lifetime value is the total revenue, or gross-margin contribution, a business expects from an average customer over the full customer lifetime. “Lifetime” here means the active relationship period, not a literal human lifespan. In practice, CLV and LTV (lifetime value) are the same metric.
A customer who spends $80 four times per year for 3 years generates $960 in revenue.
There are two main versions. Revenue-based CLV captures top-line value. Margin-based CLV subtracts direct costs such as cost of goods sold or delivery and gives a more honest picture, though it is a gross-margin measure, not net profit.
CLV is a forward-looking estimate built from past customer behavior, not a guaranteed prediction. CLV also differs from attribution, which assigns credit for a sale to a channel. For that side of measurement, see this guide to marketing attribution models. CLV instead looks at the whole stream of value from the relationship.
Core CLV Formulas for Small Businesses
Most small businesses need three versions: a simple revenue formula, a margin-based formula, and a subscription version. The building blocks are average order value (also called average purchase value), purchase frequency, average customer lifespan, and gross margin.
Simple Revenue-Based CLV Formula and Example
CLV (revenue) = Average Purchase Value x Purchase Frequency x Average Customer Lifespan
Suppose a small online store has these averages:
Average order value: $50
Average orders per year: 3
Average customer lifespan: 4 years
$50 x 3 x 4 = $600 in lifetime revenue per average customer.
This version ignores costs and the time value of money, so it suits high-level planning but not a true profitability analysis.
Margin-Based CLV Formula and Example
Margin CLV = Revenue CLV x Average Gross Margin %
If the same store has a 55 percent gross margin after direct costs such as product cost, packaging, shipping, and returns (use the same cost basis every time):
$600 x 0.55 = $330 margin-based CLV.
To find gross margin, take last year’s financials: (total revenue minus cost of goods sold) divided by total revenue. The margin version is the better one to compare with customer acquisition cost, because it shows what remains after serving the customer. For more on how margins work, see this guide to calculating net profit margin.
Churn-Based CLV for Subscription and SaaS Businesses
Subscription businesses usually use recurring revenue and churn rate instead of purchase frequency and lifespan.
Subscription CLV = (Average Revenue per Customer per Period x Gross Margin) / Churn Rate
Suppose a B2B SaaS product has these figures:
Average monthly recurring revenue per customer: $120
Gross margin: 75%
Monthly churn rate: 4%
($120 x 0.75) / 0.04 = $90 / 0.04 = $2,250.
Churn rate is the percentage of customers who cancel or do not renew in a period. If you start the month with 200 customers and 8 cancel, monthly churn is 8 / 200 = 4%. Under stable churn, average customer lifespan is approximately 1 / churn rate, so 1 / 0.04 = 25 months.
This formula assumes stable churn, stable revenue per customer, and no discounting of future cash flows (finance teams apply a discount rate so later purchases count for less). Young businesses with volatile churn should treat the result as a rough directional signal, not a precise forecast.
Calculating Customer Lifetime From Your Own Data
Pull 12 to 24 months of transaction data from a platform such as Shopify, WooCommerce, or your point-of-sale system. For each unique customer, note the first order date, last order date, total revenue, and number of orders. Then calculate:
Average order value: total revenue divided by total orders.
Purchase frequency: total orders divided by unique customers. For example, 4,500 orders from 1,500 customers in a year is 3 orders per customer per year. Annualize frequency when lifespan is measured in years: if your data covers 24 months, divide by two.
Average customer lifespan: track cohort retention over time (the share of customers acquired in a given quarter who are still active after 12, 24, and 36 months), or approximate it from churn where churn is reasonably stable. If annual churn is 25 percent, lifespan is roughly 1 / 0.25 = 4 years.
A CLV estimate is only as good as the data behind it, so check that records are complete before you rely on the result.
CLV, CAC, and Marketing Spend: Using the Numbers Together
Customer acquisition cost (CAC) is the average amount spent to win a new customer: total marketing and sales spend in a period divided by new customers acquired in that period.
Suppose a business spends $18,000 on marketing and sales in a quarter and acquires 300 customers. CAC = $18,000 / 300 = $60. With a margin CLV of $330, the CLV to CAC ratio is $330 / $60 = 5.5 to 1. That is about $5.50 of expected lifetime gross margin per acquisition dollar, not net profit or an immediate cash return.
A commonly cited SaaS rule of thumb, popularized by investor David Skok, is a CLV to CAC ratio above 3:1. His SaaS metrics guide describes this and a CAC payback period under 12 months as guidelines only, and notes cases where breaking them makes sense. They were developed for SaaS, so treat them as a starting point for a local service or e-commerce business, not a universal standard.
A ratio at or below 1:1 signals little or no estimated contribution remaining after acquisition costs, before other expenses.
Retention also affects this math. Harvard Business Review has cited estimates that acquiring a new customer costs anywhere from five to 25 times more than retaining an existing customer, depending on the study and industry. The range is wide, so treat it as direction, not a forecast.
Key Factors That Influence Customer Lifetime Value
CLV is driven by a few controllable levers: how much customers spend, how often they buy, how long they stay, and what it costs to serve them.
Average order value multiplies through the whole formula. Purchase frequency is a second multiplier: if the average customer buys 3 times per year instead of 2, CLV rises by 50 percent with no change in acquisition cost or lifespan.
Customer retention is often the strongest lever. Under a simplified constant-churn model, expected lifetime is roughly the inverse of churn, so cutting annual churn from 25 percent to 20 percent stretches average lifespan from 4 years to 5. Customer satisfaction and customer feedback signal whether lifetime is likely to grow or shrink, and loyal customers who buy repeatedly are worth identifying early. For more on managing customer relationships, see practical client relationship management systems.
CLV Segmentation: By Customer, Profile, and Channel
A single overall CLV number can hide important differences between customer segments, acquisition channels, and products.
Two customers might both start with a $60 first purchase, yet one orders quarterly for years and the other never returns. To compare groups, calculate CLV for each profile or channel with the same formulas, such as organic search versus paid social, or walk-in customers versus email subscribers. Your analytics setup, such as the one described in this guide to using Google Analytics for decisions, can help show which channels bring customers in.
For example, suppose organic search customers have a CAC of $30 and an average margin-based CLV of $400, while paid social customers have a CAC of $70 and an average margin-based CLV of $200, both measured the same way for comparable customer groups. In this hypothetical, organic search delivers more valuable customers at a lower acquisition cost, which would directly inform how you allocate your marketing budget across channels. Even two or three basic segments, such as new versus returning or high value customers versus the rest, can show where retaining customers pays off most.
Limitations of CLV and How to Use It Safely
CLV is an estimate based on assumptions about future behavior, not a precise forecast or guarantee. Common limitations include:
Rapidly changing markets or pricing: a model built on last year’s data may misestimate if preferences or costs shift abruptly.
Incomplete data: if you sell online and in store without unified customer identifiers, you may undercount or double-count customers.
Small sample sizes: early-stage businesses or those with few renewal cycles will have noisy estimates.
CLV can also be distorted if major costs are excluded. Suppose a revenue CLV of $600 looks strong until high support costs, returns, and discounts reduce the margin CLV to $120. The number is only useful if it is calculated honestly.
Use CLV as one input alongside cash flow, payback period, and operational capacity, not as the sole deciding metric.
Practical Ways to Improve Customer Lifetime Value
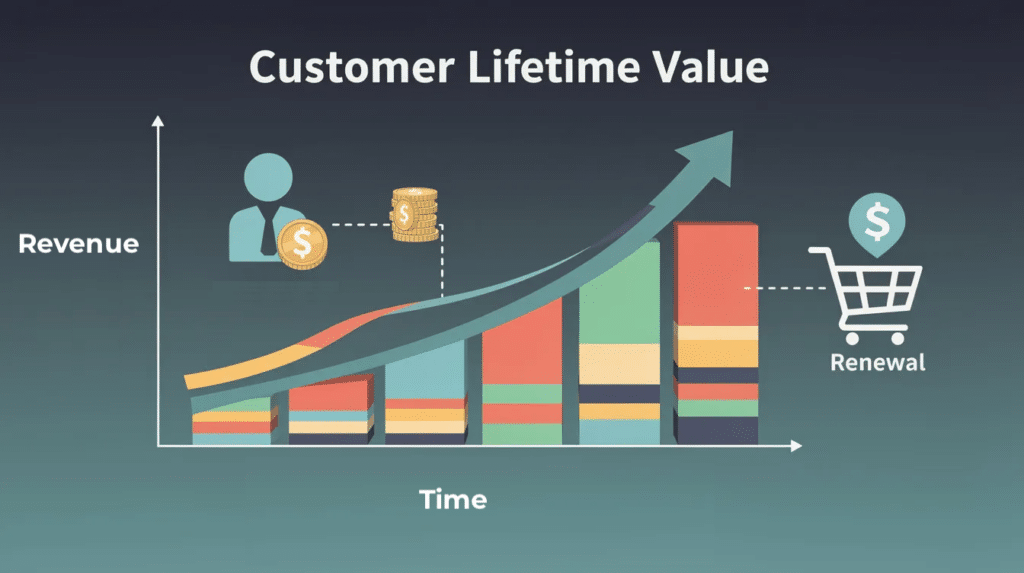
Improving CLV comes down to longer lifetime, higher purchase frequency, higher average order value, and healthier margins. For retention, post-purchase follow-ups, service reminders, onboarding sequences for SaaS users, and win-back campaigns for lapsed customers can help extend customer relationships, though each tactic should be weighed against its cost. A small customer success effort that helps existing customers get value from your product can build customer loyalty and reduce churn.
To increase purchase frequency, use email marketing with helpful content, reorder reminders, and simple loyalty initiatives that avoid deep discounts that erode margin.
To raise average order value, offer relevant bundles, cross-sells that match real customer needs, and minimum order thresholds that do not hurt the customer experience. These tactics work best when based on real customer data and the customer journey rather than guesswork.
Building a Simple CLV System in Your Marketing Operations
Treat CLV as a recurring process, not a one-time calculation. A lightweight system looks like this:
Define your core CLV formula (revenue-based or margin-based, depending on your business model).
Schedule regular data pulls from your e-commerce platform, CRM, accounting software, or email marketing tools.
Track CLV for at least one or two key customer segments.
Review CLV alongside CAC and marketing spend every quarter.
Align customer identifiers across data sources so no customer is counted twice. One dashboard or spreadsheet tab showing the current CLV estimate, CAC, CLV to CAC ratio, and the trend over the last four quarters is enough to support clearer acquisition and retention decisions.
